Focusing
Limelight 3G ships with an unglued lens to allow for lens swaps and manual focusing.
Plug your LL3G into your laptop over USB.
Open the LL Hardware Manager and click "Find Limelights". Double click the entry that begins with ether 172.172 or 169.254
Change your Limelight's team number to 99987 to enable full-res streaming. This step will not be necessary in future updates.
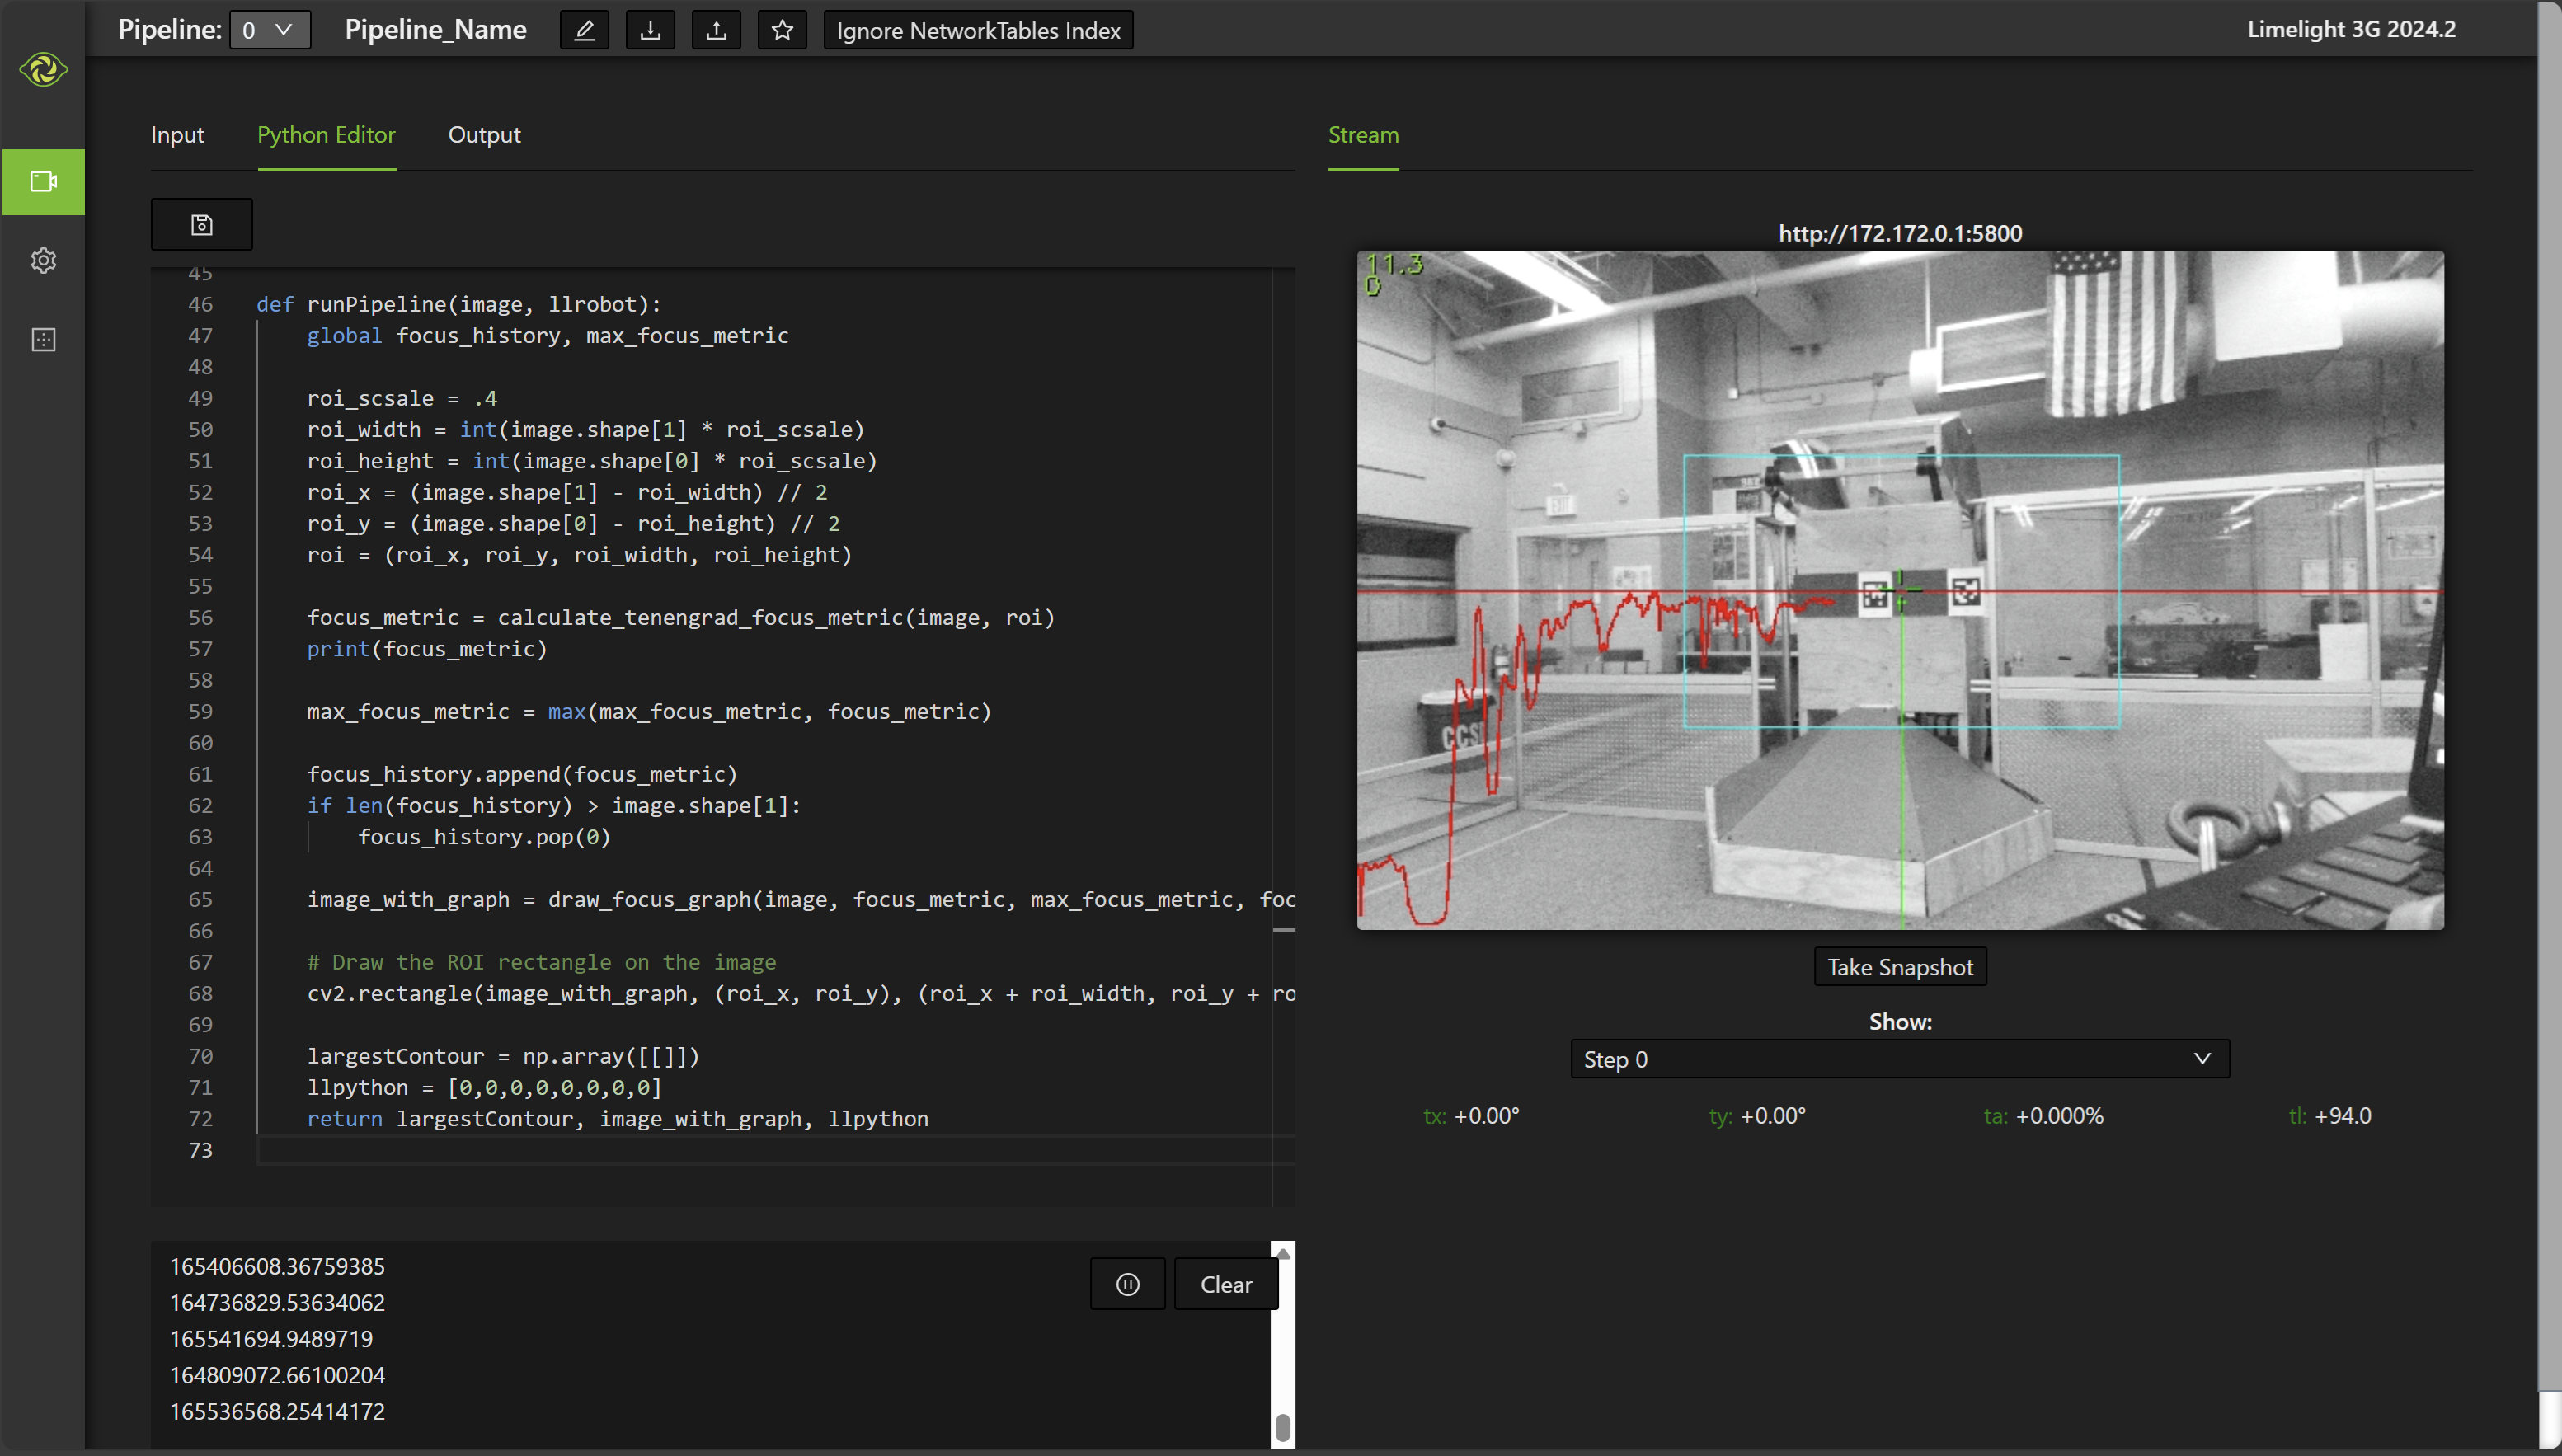
The following snapscript will print a focus metric to the Python Editor Log that represents the "focus" of the current frame.
Re-save the script or press ctrl-s in the editor to restart the script and clear the graph.
Once focused, apply 3-8 dots of super glue or super glue gel around the lens
For the absolute best results, you can consider using a large siemens star focus chart as your target
Your limelight should be still and looking at an object at least 5 ft away. Turn the lens until the focus metric is as high as it can get. You will notice that it peaks when the image is as focused as possible.
import cv2
import numpy as np

# Global variables
highest_focus_value = 0
focus_history = []
max_focus_metric = 50


def calculate_tenengrad_focus_metric(image, roi):
    roi_image = image[roi[1]:roi[1]+roi[3], roi[0]:roi[0]+roi[2]]
    gx = cv2.Sobel(roi_image, cv2.CV_64F, 1, 0, ksize=3)
    gy = cv2.Sobel(roi_image, cv2.CV_64F, 0, 1, ksize=3)
    gm = cv2.addWeighted(np.square(gx), 0.5, np.square(gy), 0.5, 0)
    return gm.var()

def draw_focus_graph(image, focus_value, max_value, focus_history):
    global highest_focus_value
    graph_height = (int)(image.shape[0] * 0.5)
    graph_width = image.shape[1]

    # Update the highest focus value
    highest_focus_value = max(highest_focus_value, focus_value)

    # Define the area on the original image where the graph will be drawn
    graph_area_start = image.shape[0] - graph_height
    graph_area = image[graph_area_start:image.shape[0], 0:graph_width]

    # Draw the highest focus line
    normalized_highest_focus = int((highest_focus_value / max_value) * graph_height)
    cv2.line(graph_area, (0, graph_height - normalized_highest_focus), (graph_width, graph_height - normalized_highest_focus), (0, 0, 255), 2)

    # Draw the current focus cross
    normalized_focus_value = int((focus_value / max_value) * graph_height)
    cv2.line(graph_area, (graph_width // 2, graph_height), (graph_width // 2, graph_height - normalized_focus_value), (0, 255, 0), 2)
    cv2.line(graph_area, (graph_width // 2 - 5, graph_height - normalized_focus_value), (graph_width // 2 + 5, graph_height - normalized_focus_value), (0, 255, 0), 2)

    # Draw the live graph for previous focus results
    for i in range(1, len(focus_history)):
        prev_normalized_value = int((focus_history[i-1] / max_value) * graph_height)
        curr_normalized_value = int((focus_history[i] / max_value) * graph_height)
        cv2.line(graph_area, (i-1, graph_height - prev_normalized_value), (i, graph_height - curr_normalized_value), (0, 0, 255), 2)

    return image

def runPipeline(image, llrobot):
    global focus_history, max_focus_metric

    roi_scsale = .4
    roi_width = int(image.shape[1] * roi_scsale)
    roi_height = int(image.shape[0] * roi_scsale)
    roi_x = (image.shape[1] - roi_width) // 2
    roi_y = (image.shape[0] - roi_height) // 2
    roi = (roi_x, roi_y, roi_width, roi_height)

    focus_metric = calculate_tenengrad_focus_metric(image, roi)
    print(focus_metric)

    max_focus_metric = max(max_focus_metric, focus_metric)

    focus_history.append(focus_metric)
    if len(focus_history) > image.shape[1]:
        focus_history.pop(0)

    image_with_graph = draw_focus_graph(image, focus_metric, max_focus_metric, focus_history)

    # Draw the ROI rectangle on the image
    cv2.rectangle(image_with_graph, (roi_x, roi_y), (roi_x + roi_width, roi_y + roi_height), (255, 255, 0), 2)

    largestContour = np.array([[]])
    llpython = [0,0,0,0,0,0,0,0]
    return largestContour, image_with_graph, llpython